pimatic-charts


This plugin provides a chart device for the pimatic frontend. It is based on highcharts.
Please make feature requests!
Features
- Chart device
- Gauge device
- Many customization options
Installation
Just activate the plugin in your pimatic config. The plugin manager automatically installs the package with his dependencys.
Configuration
You can load the plugin by adding following in the config.json from your pimatic server:
{
  "plugin": "charts",
  "debug": true
}
Usages
The devices are based on the built-in variable device from pimatic.
Chart device
The device needs only one configured variable. The config has a default y axis definition. You can assign each variable to one y axis. But also all variables to the same axis.
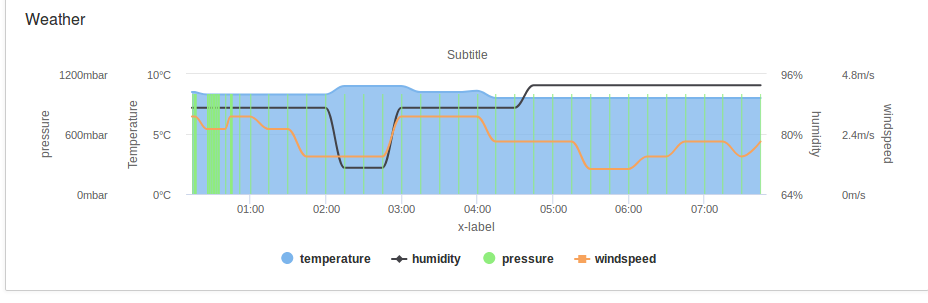
Example chart device:
{
  "variables": [
    {
      "name": "pressure",
      "expression": "$wetter.pressure",
      "type": "number",
      "chart": "areaspline",
      "yaxis": 2,
      "dashstyle": "Solid",
      "color": "#a6c96a"
    },
    {
      "name": "temperature",
      "expression": "$wetter.temperature",
      "type": "number",
      "step": false,
      "chart": "areaspline",
      "yaxis": 0,
      "dashstyle": "Solid",
      "color": "#f28f43"
    },
    {
      "name": "humidity",
      "expression": "$wetter.humidity",
      "type": "number",
      "step": false,
      "chart": "spline",
      "yaxis": 1,
      "dashstyle": "Solid"
    },
    {
      "name": "windspeed",
      "expression": "$wetter.windspeed",
      "type": "number",
      "chart": "spline",
      "yaxis": 3,
      "dashstyle": "Solid"
    }
  ],
  "echo": {
    "additionalNames": []
  },
  "id": "testchart",
  "name": "Weather",
  "class": "ChartDevice",
  "xlabel": "x-label",
  "height": 250,
  "subtitle": "Subtitle",
  "timerange": "7d",
  "legend": true,
  "interval": 5,
  "yaxis": [
  {
    "label": "Temperature",
    "unit": "°C"
  },
  {
    "label": "humidity",
    "opposite": true,
    "unit": "%"
  },
  {
    "label": "pressure",
    "unit": "mbar"
  },
  {
    "label": "windspeed",
    "unit": "m/s",
    "opposite": true
  }
],
"allowzoom": true,
"allowtrace": true,
"datebuttons": [
  {
    "label": "3day",
    "count": 6,
    "unit": "day",
    "datagrouping": true
  },
  {
    "label": "1min",
    "count": 1,
    "datagrouping": false,
    "unit": "minute"
  },
  {
    "label": "3day",
    "count": 3,
    "unit": "day",
    "datagrouping": false
  },
  {
    "label": "ALL",
    "unit": "all",
    "count": 0,
    "datagrouping": false
  }
],
"showdatepicker": true
},
Gauge device
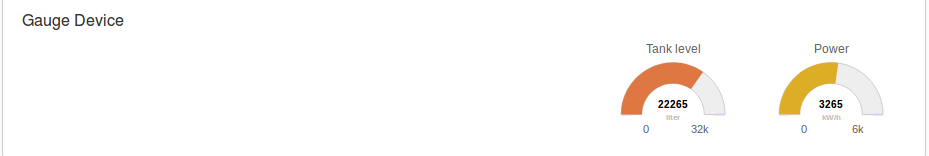
Example gauge device:
{
  "scale": 0.8,
  "variables": [
    {
      "name": "Tank",
      "expression": "$tank",
      "type": "number",
      "min": 0,
      "max": 30000,
      "unit": "liter",
      "showRange": true,
      "label": "Tank level"
    },
    {
      "name": "Power",
      "expression": "$power",
      "type": "number",
      "min": 0,
      "max": 5000,
      "unit": "kW/h",
      "showRange": true,
      "label": "Power"
    }
  ],
  "echo": {
    "additionalNames": []
  },
  "id": "gauge",
  "name": "Gauge Device",
  "class": "GaugeDevice"
},
ChangeLog
- 0.0.1 : First public version
- 0.0.2 :
- BUGFIX (#1: UTC)
- dashStyle included
- 0.0.3 :
- line colors
- date picker
- 0.0.4 :
- FIX #5 & #6
LICENSE
This plugin is licenses under CC BY-NC 3.0 and is not free for commercial and Governmental use.
Credits
This plugin uses highchart. Highcharts JS v6.0.2 (2017-10-20) (C) 2009-2016 Torstein Honsi www.highchart.com